Microsoft Power BI Services

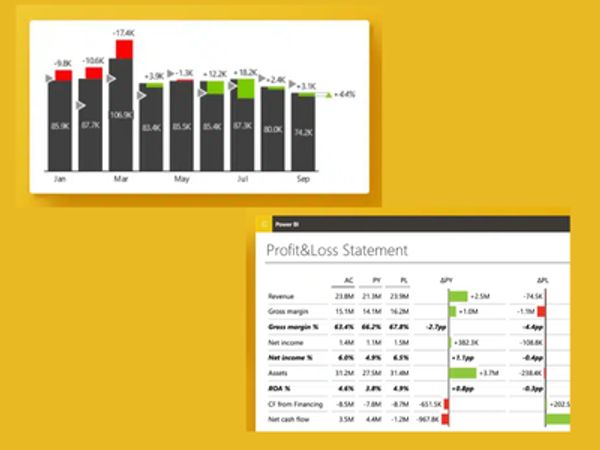
Power BI Dashboard Development
Interactive dashboards designed to visualize business data clearly and effectively for quick decision-making.
Power BI Reports & Data Analysis
Detailed reports and analyses created to transform raw data into actionable insights.
Power BI Data Modeling
Robust data models designed and implemented to organize and relate data from multiple sources for accurate reporting.
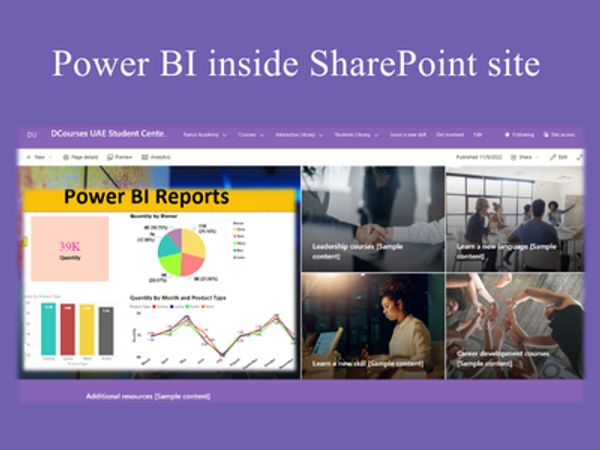
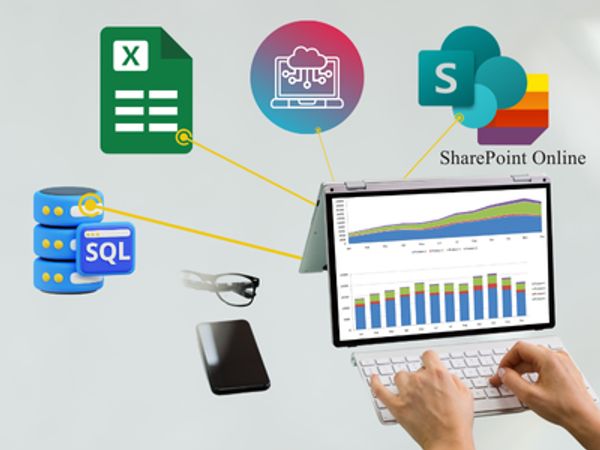
Power BI Integration with SharePoint & Office 365
Power BI connected with SharePoint lists, Excel, and Office 365 apps to automate data collection and visualization.

Power BI Datasets & Data Sources Setup
Data sources, datasets, and refresh schedules configured to ensure reports are always up-to-date.
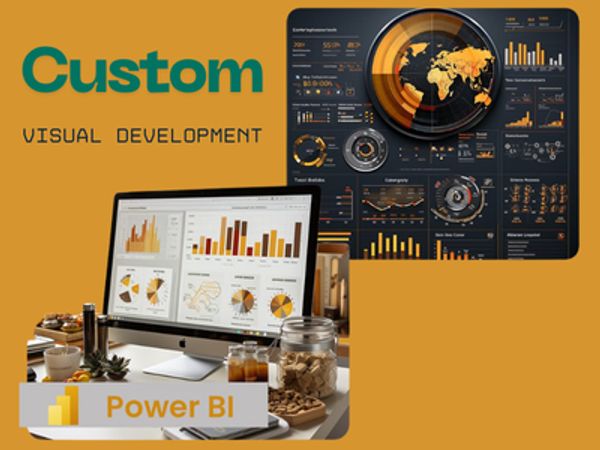
Power BI Custom Visuals Development
Custom visuals developed to present data in a unique and interactive way tailored to business needs.

Power BI Embedded Solutions
Reports and dashboards embedded into applications or portals for seamless access to analytics.
Power BI Governance & Best Practices
Best practices implemented for workspace management, security, and data governance to maintain reliable analytics.

Power BI Training & Support
Training sessions and ongoing support provided to help teams confidently create, read, and interpret dashboards and reports.
Advanced Analytics & Insights
Advanced analytics techniques applied, including DAX calculations, KPIs, and predictive insights for data-driven decisions.